 |
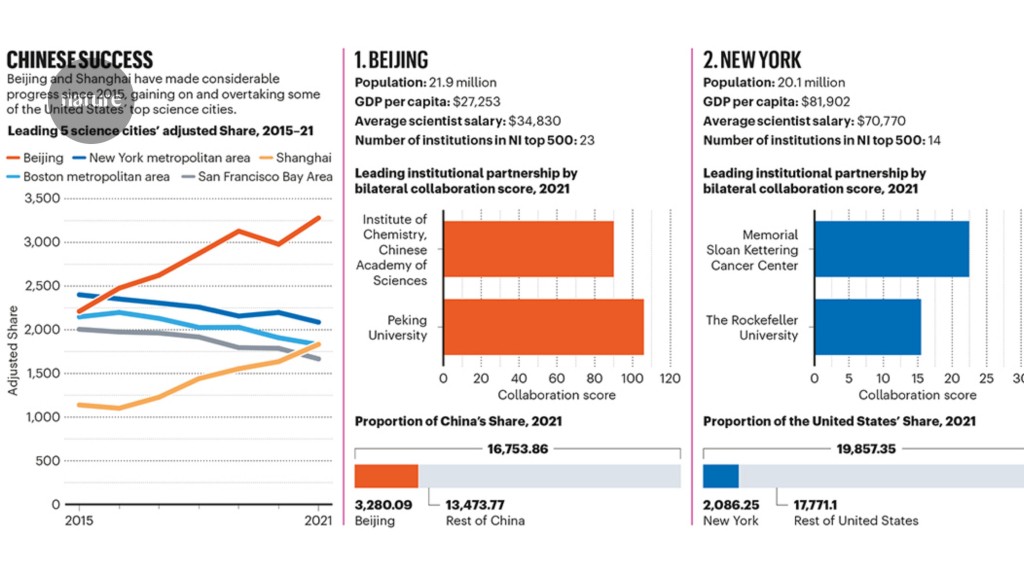
From the Editor's Desk Beijing and Shanghai have made considerable progress since 2015, gaining on and overtaking some of the United States’ top science cities. Boston, New York and San Francisco have meanwhile fallen slightly in their output of science papers within the Nature Index. Changes to each of the leading five science cities’ adjusted Share since 2015 are shown below, along with a breakdown of the top collaborating institutions within each city. Because large network organizations, such as the Chinese Academy of Sciences, span multiple cities, we have counted their constituent bodies instead when calculating the number of institutions in the top 500 of the Index. All population statistics date from 2020. GDP per capita figures in Chinese cities date from 2021 and in US cities date from 2019. All currency data expressed in US dollars. |
Friday 19th April 2024
Top stories this week